The M&A Insider


Exit Strategy
Why Most Internal Business Transfers Fail — And How to Get It Right

General
Guide to a Retained Buy-Side M&A: Pursuing Growth Through Acquisition

General
What Is the Difference Between an IOI and a LOI?

General
How to Handle Valuation Disputes in Mergers or Sales

M&A Process
Understanding Capital Structure in M&A: A Guide for Buy-Side Clients

General
Top Challenges in Healthcare Revenue Cycle Management

M&A Process
How to Manage the Post-Acquisition Integration Process

General
How Private Equity Investments Are Transforming Medical Spas

M&A Process
How to Identify the Right Targets for Acquisition


General
Beyond The Purchase Price: What Is My Net After-Tax Proceeds?

Exit Strategy
The Pre-Sale Playbook: 5 Priorities for a Successful Business Exit

General
Why Your Business is NOT Valued on a Multiple of EBITDA

Exit Strategy
Preparing for a Successful Business Exit

General
EBITDA Multiples for Understanding Business Valuation

General
Looking Back at Mergers and Acquisitions in 2024 + What’s Next for 2025

General
What is the Lower Middle Market in Mergers and Acquisitions?

Exit Strategy
The Best Time to Sell a Behavioral Health Practice

Exit Strategy
M&A Insights: Chris Jones in New State, New Life - Making the Move with Financial Success

Exit Strategy
Private Equity's Growing Interest in Behavioral Health: What Practice Owners Need to Know

General
The Importance of Technology in Post-Merger Integration

Exit Strategy
What Do Reps, Warranties, and Escrow Mean, and What Is the Purpose When I Am Selling My Company?

General
What Is Normalized Net Working Capital?

M&A Process
The QuietAuction™ Process: Exploring the Mechanics and Benefits of a Controlled Sale Approach in Mergers and Acquisitions

General
What Are Intangible Assets, and Why Do They Matter in Modern Business?

Exit Strategy
What Is EBITDA (Earnings Before Income Tax, Depreciation, Amortization)?

M&A Process
The Difference Between a Merger, Acquisition & Takeover

General
How Upcoming Capital Gains Tax Changes Could Affect Your Business Sale

Exit Strategy
Selling to the Key Employee

General
Do You Need a Sandbagging Provision?

Exit Strategy
Is Now the Time to Sell My Company?

General
Understanding Business Valuation Techniques

Exit Strategy
Red Flags in Due Diligence

General
The Impact of Consumer Health Trends on Medical Spa M&A

M&A Process
Integration Planning: Overcoming Common Challenges to Achieve M&A Success

M&A Process
The Role of Private Equity in M&A Deals

M&A Process
The Evolution of M&A: From Traditional Models to Digital Transformations

Exit Strategy
True North CEOs Five Biggest Deal Killers When Selling Company

General
Why Are Private Equity Groups Acquiring So Many Medical Aesthetic Practices?

M&A Process
The Rise of M&A in the Healthcare Sector: Opportunities in Medical Spas and Beyond

General
Healthcare Revenue Cycle Trends | True North Mergers & Acquisitions

m-a-process
M&A in the Healthcare Industry and What To Consider For Consolidation

Exit Strategy
Navigating Business Sales: Insights From CEO Brian Slipka

M&A Process
Post-Merger Integration: Strategies for Success in the Medical Spa Industry

M&A Process
The Growing Importance of Environmental, Social, and Governance (ESG) Factors in Mergers & Acquisitions

M&A Process
What Can Be Learned From Failed Attempts At Merging & Acquiring Technology Companies

M&A Process
What You Need to Know About Executing a Successful Merger or Acquisition in the Technology Industry

M&A Process
Know Your Company’s Value with a Compass Exit Opinion from True North

M&A Process
Navigating the Seller's Emotional State in an M&A Transaction

M&A Process
The Different Types of Mergers & Acquisitions Transactions Explained

M&A Process
How Tech Companies Can Benefit From Outsourcing Their Mergers & Acquisitions Strategy

M&A Process
How to Prepare Your Company for a Merger or Acquisition

Exit Strategy
Balancing Security with Convenience and the Impact of the Human Element

M&A Process
Navigating the Complexities of Mergers and Acquisitions in the Technology Sector

M&A Process
The Challenge of M&A Technical Due Diligence

M&A Process
Considering Selling Your Business? How to Find the Right Mergers & Acquisitions Advisor For You

M&A Process
The Impact of Mergers & Acquisitions on Corporate Culture

Exit Strategy
Should I get a Business Price Opinion?

M&A Process
How To Properly Conduct Cultural Due Diligence to Ensure Your M&A Transaction is Successful

M&A Process
The 5 Most Common Mistakes Companies Make During Mergers & Acquisitions

M&A Process
Looking to Buy a Prosperous Business or Ready to Sell Your Own? Consider a Merger or Acquisition

General
What's Happening Inside Minnesota's Manufacturing Industry? Find Out November 9.

Exit Strategy
What Are The Key Elements Of An Exit Strategy?

M&A Process
What Your Company Can Expect During the Merger or Acquisition Process

Exit Strategy
What to Know About Selling a Medical Spa To Private Equity

Exit Strategy
How Much Can I Sell My Medical Spa For? How to Value a Practice

General
Acquihires: What You Need to Know

Exit Strategy
3 Value Drivers You Can Start Installing Right Now

General
Company Diversity Audits: What to Look For

M&A Process
5 Reasons to Hire the Right Merger & Acquisitions Advisor
General
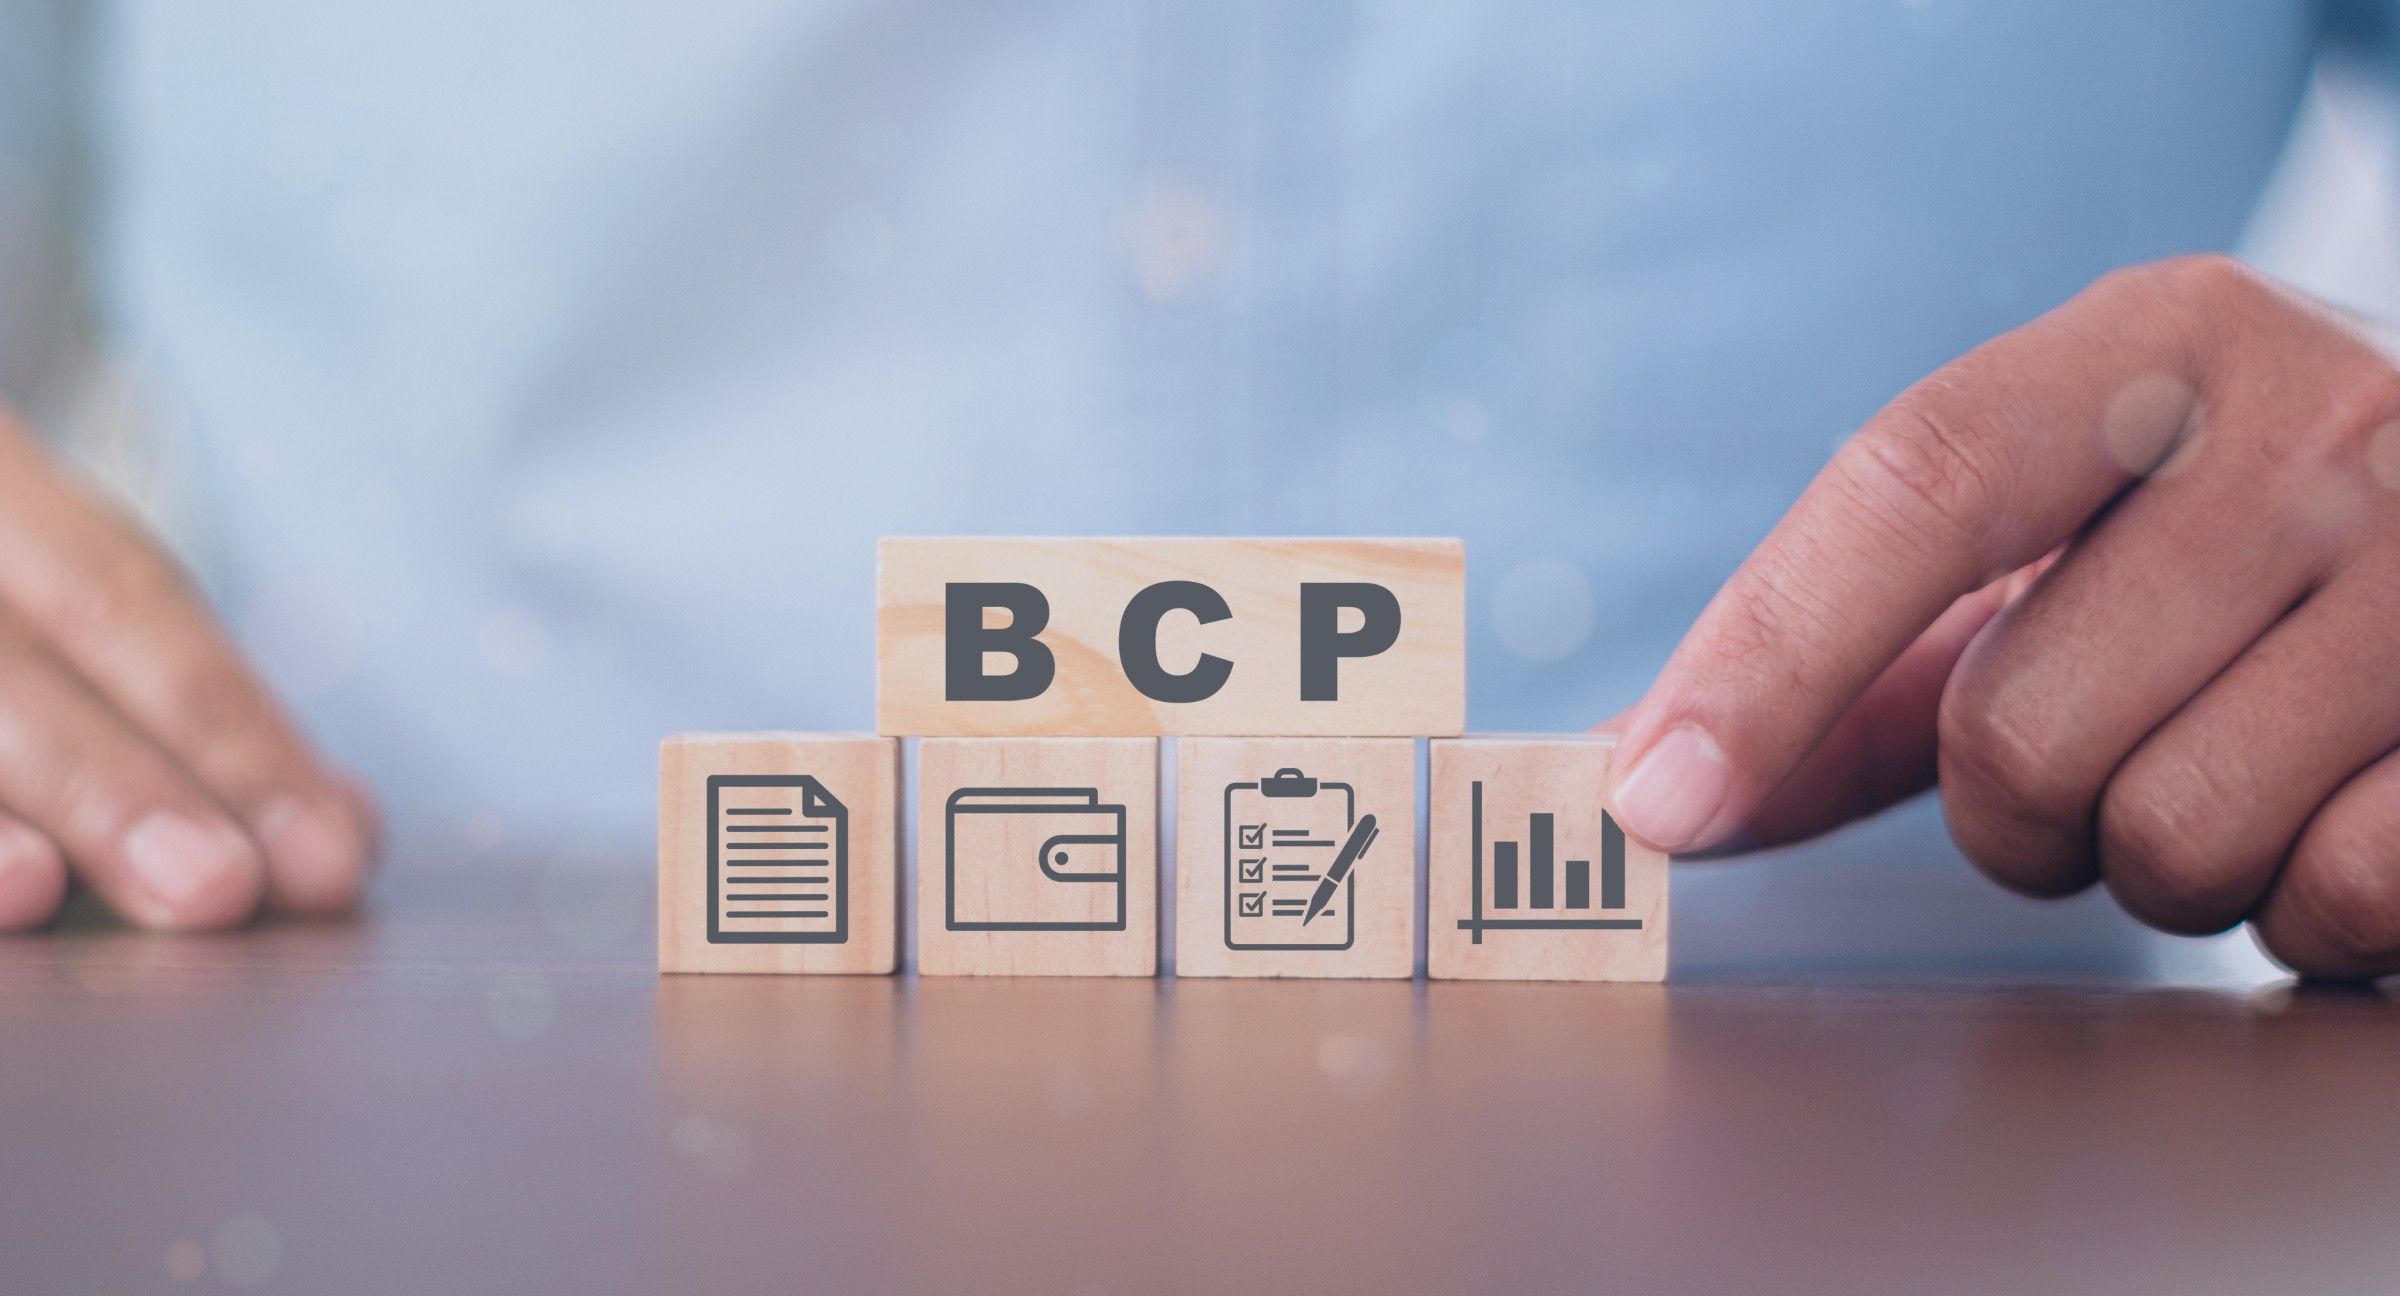
3 Steps to Creating a Successful Business Continuity Plan

General
How to Protect Your Business’s Most Valuable Assets

Exit Strategy
How to Make Your MSP Business More Attractive to Potential Buyers

Exit Strategy
5 Ingredients to a Successful Transfer of Business Ownership

Exit Strategy
Increase Your Business Value With 3 Key Business Value Drivers

General
Business Planning: Why You Should Hire a Business Advisor

General
5 Steps to Plan for Retirement if You’re a Business Owner

General
How to Protect Your Business with a Succession Plan

M&A Process
Why Are Private Equity Firms Buying So Many Medical Spas?

Exit Strategy
If You Don’t Uncover the Skeletons in Your Closet, Your Buyer Will Don’t Miss This Important Step in Selling Your Business

General
How to Jumpstart the Planning Process Following a Process Ensures Positive Results

Exit Strategy
How Do I Get My Tech Business Ready to Sell? Understand These Factors Before You Sell Your Tech Business